01 · THE DASHBOARD
Every service on one screen.
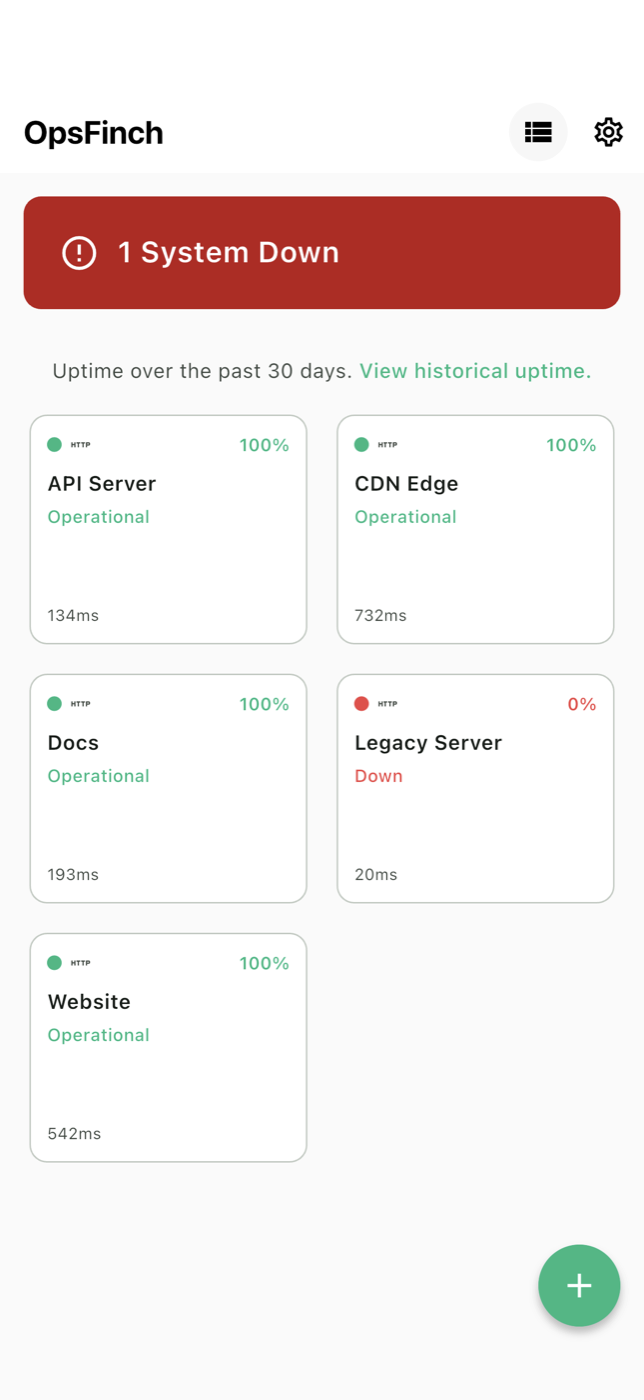
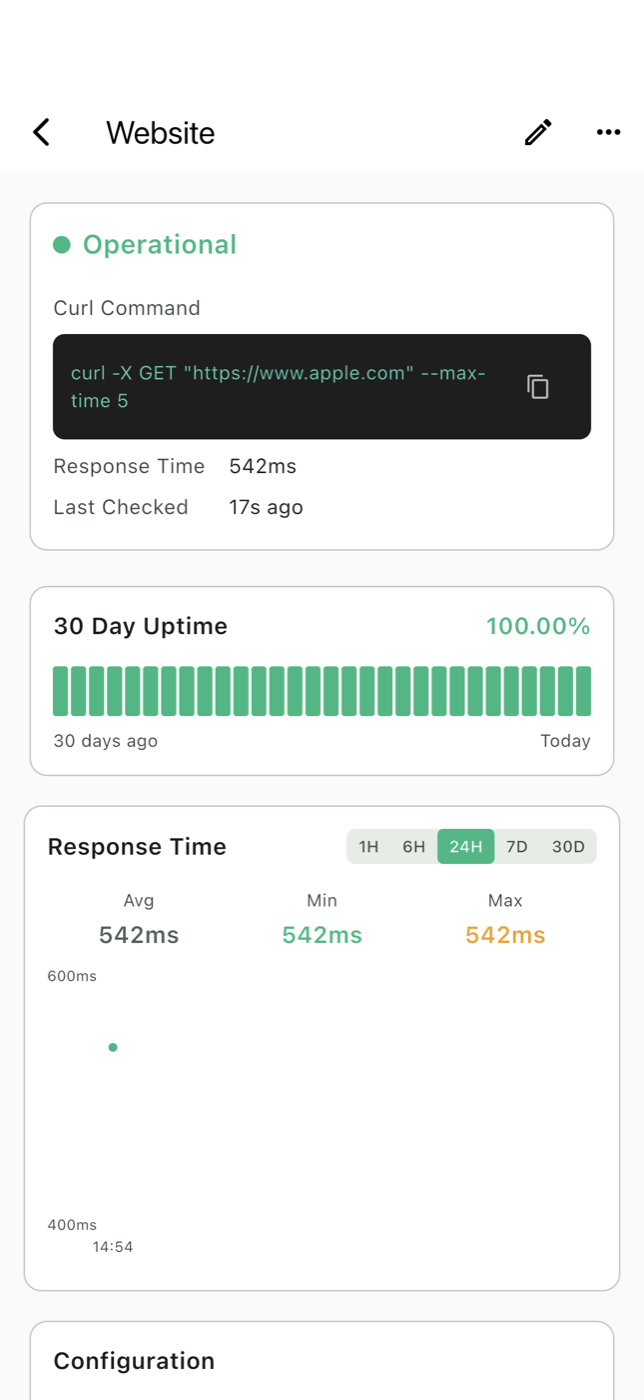
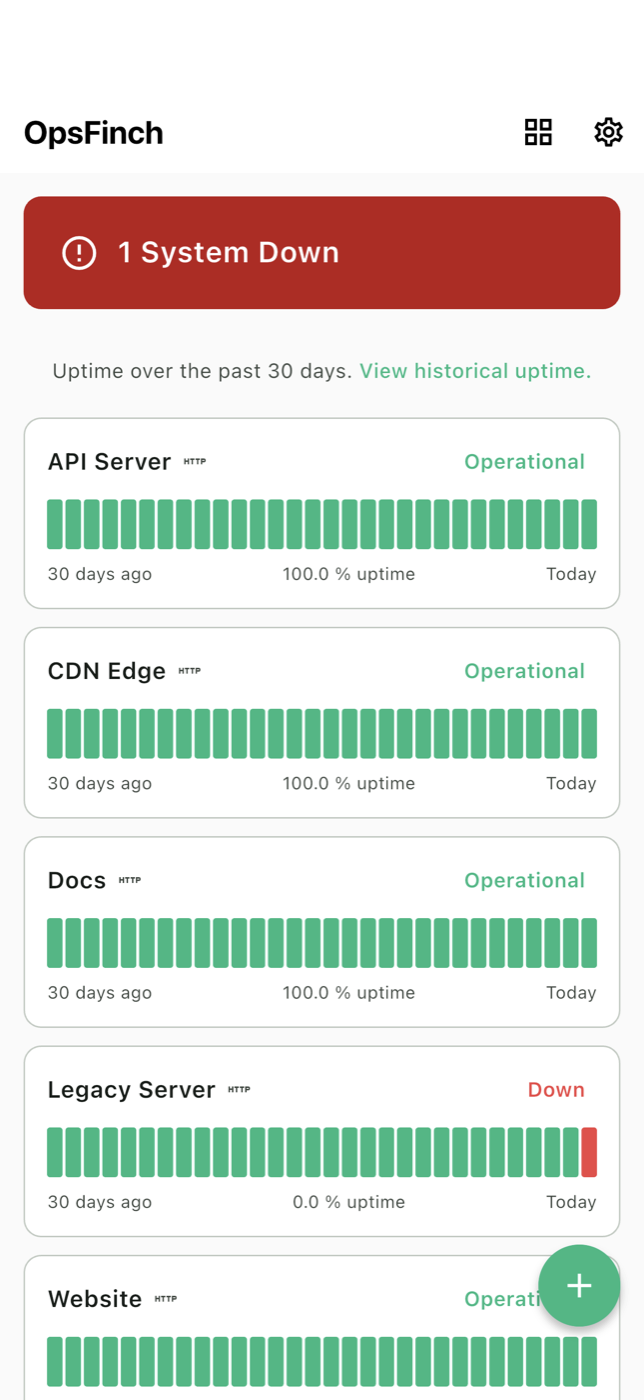
Open the app and you know exactly where you stand. Each endpoint gets a 30-day uptime bar — a row of green until the moment something drops, when the banner up top turns red and tells you how many systems are down.
- 30-day uptime bars for every endpoint
- Live Operational / Down status per service
- Historical uptime one tap away